

The world recently experienced a 13-month streak of record-breaking global temperatures. And as blistering heat waves punish communities across several continents, 2024 is on track to be the hottest year on record. Global average temperatures are now perilously close to exceeding 1.5 degrees C (2.7 degrees F) above pre-industrial levels, a threshold scientists warn will bring increasingly dangerous droughts, wildfires and other impacts of climate change. Researchers project nearly 3 degrees C (5.4 degrees F) of temperature rise by 2100 without significant action to reduce greenhouse gas emissions.
That means almost 600 million people will be exposed to flooding from rising seas, food production will drop by as much as half and habitats will suffer disastrous levels of loss. But what will 3 degrees C of warming vs. 1.5 degrees C look like in specific places — like Bengaluru, Johannesburg, Rio de Janeiro or the city you live in?
New data from WRI finds that in most cities, the difference between 3 degrees C and 1.5 degrees C of warming is sizable. We analyzed potential climate hazards for nearly 1,000 of the world’s largest cities1 — currently home to 2.1 billion people, or 26% of the global population2 — using estimates based on downscaled global climate models. At 3 degrees C of warming, many cities could face month-long heat waves, skyrocketing energy demand for air conditioning, as well as a shifting risk for insect-borne diseases — sometimes simultaneously. People in low-income cities are likely to be the hardest hit.
These findings hold immense consequences for people’s lives and livelihoods, as well as for cities’ economies, infrastructure and public health systems. The implications are especially important as cities are home to 4.4 billion people globally — more than half the world’s population — and will grow rapidly over the next two decades. By 2050, as another 2.5 billion people move to urban areas, two-thirds of humanity will live in cities, with over 90% of that growth in Africa and Asia.
About This Data
Global climate models often don’t produce data granular enough to be usable at a local level. For this article, we produced a global data set that includes data on 14 heat- and precipitation-related climate hazards for the 996 cities with populations greater than 500,000 people using a new statistical modeling method (designed by WRI) that makes it easier to project city-scale impacts from global climate models.
Here, we unpack what conditions may look like in the world’s largest cities if global warming reaches 3 degrees C, compared to 1.5 degrees C:
Longer and More Frequent Heat Waves
Study after study show that people die and economies slow down during prolonged periods of abnormally high temperatures. Even when temperatures do not approach life-threatening highs, heat waves can elevate risks to agriculture and infrastructure, such as crop failures and increased energy demand. At 3 degrees C of warming, most cities can expect both longer and more frequent heat waves than at 1.5 degrees C.3
Longer, more frequent heat waves can take a massive toll on public health and social and economic development. The impacts of extreme heat can be life-threatening, especially on vulnerable groups like pregnant women, the elderly or children. And within cities, poorer neighborhoods will feel the effects more sharply, as they often have fewer green areas to cool the air, poorer quality buildings and less access to mechanical cooling.
Combined with air pollution, an all-too-common problem in cities, heat waves become even deadlier. For example, cardiovascular diseases are exacerbated by extreme temperatures and by tropospheric ozone, the formation of which increases at higher temperatures. Heat waves also exacerbate wildfires, which can increase exposure to PM2.5 pollution, a known carcinogen linked to diseases and premature death.
And beyond the impacts on human health, extreme heat can strain water, energy and transport systems, disrupting food chains and agriculture.
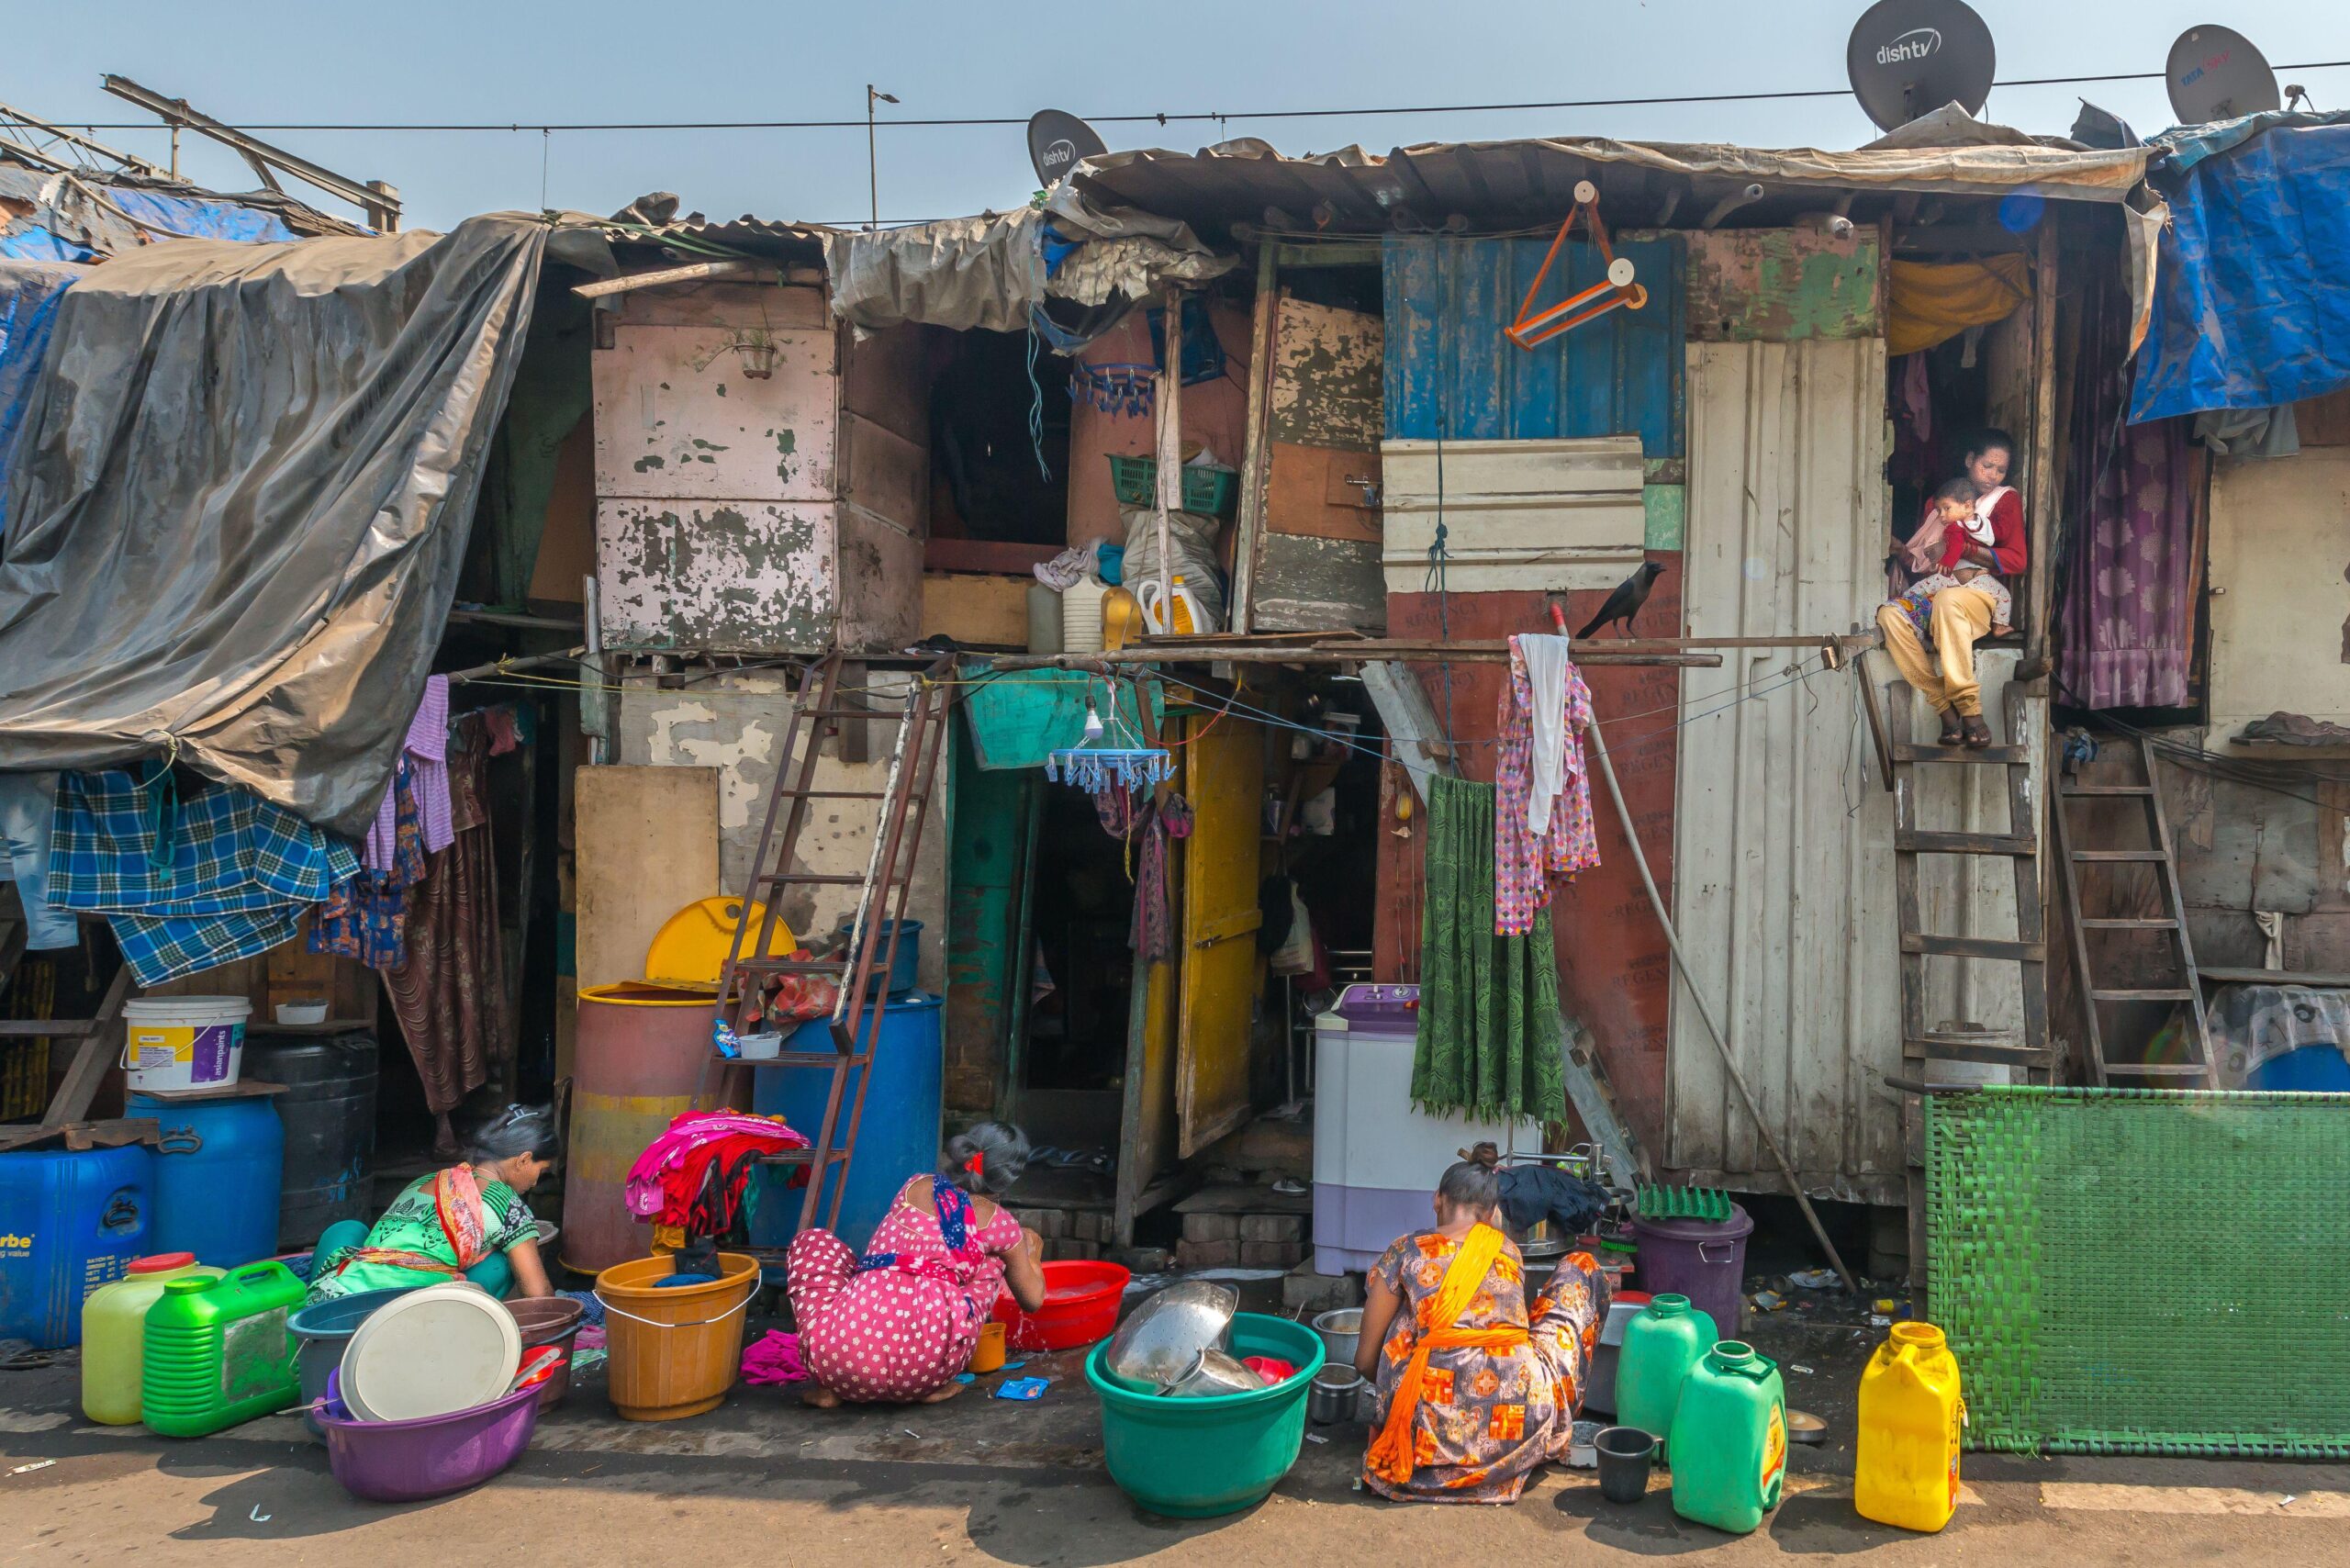
City Solution: Inclusive Resilience in Bengaluru, India
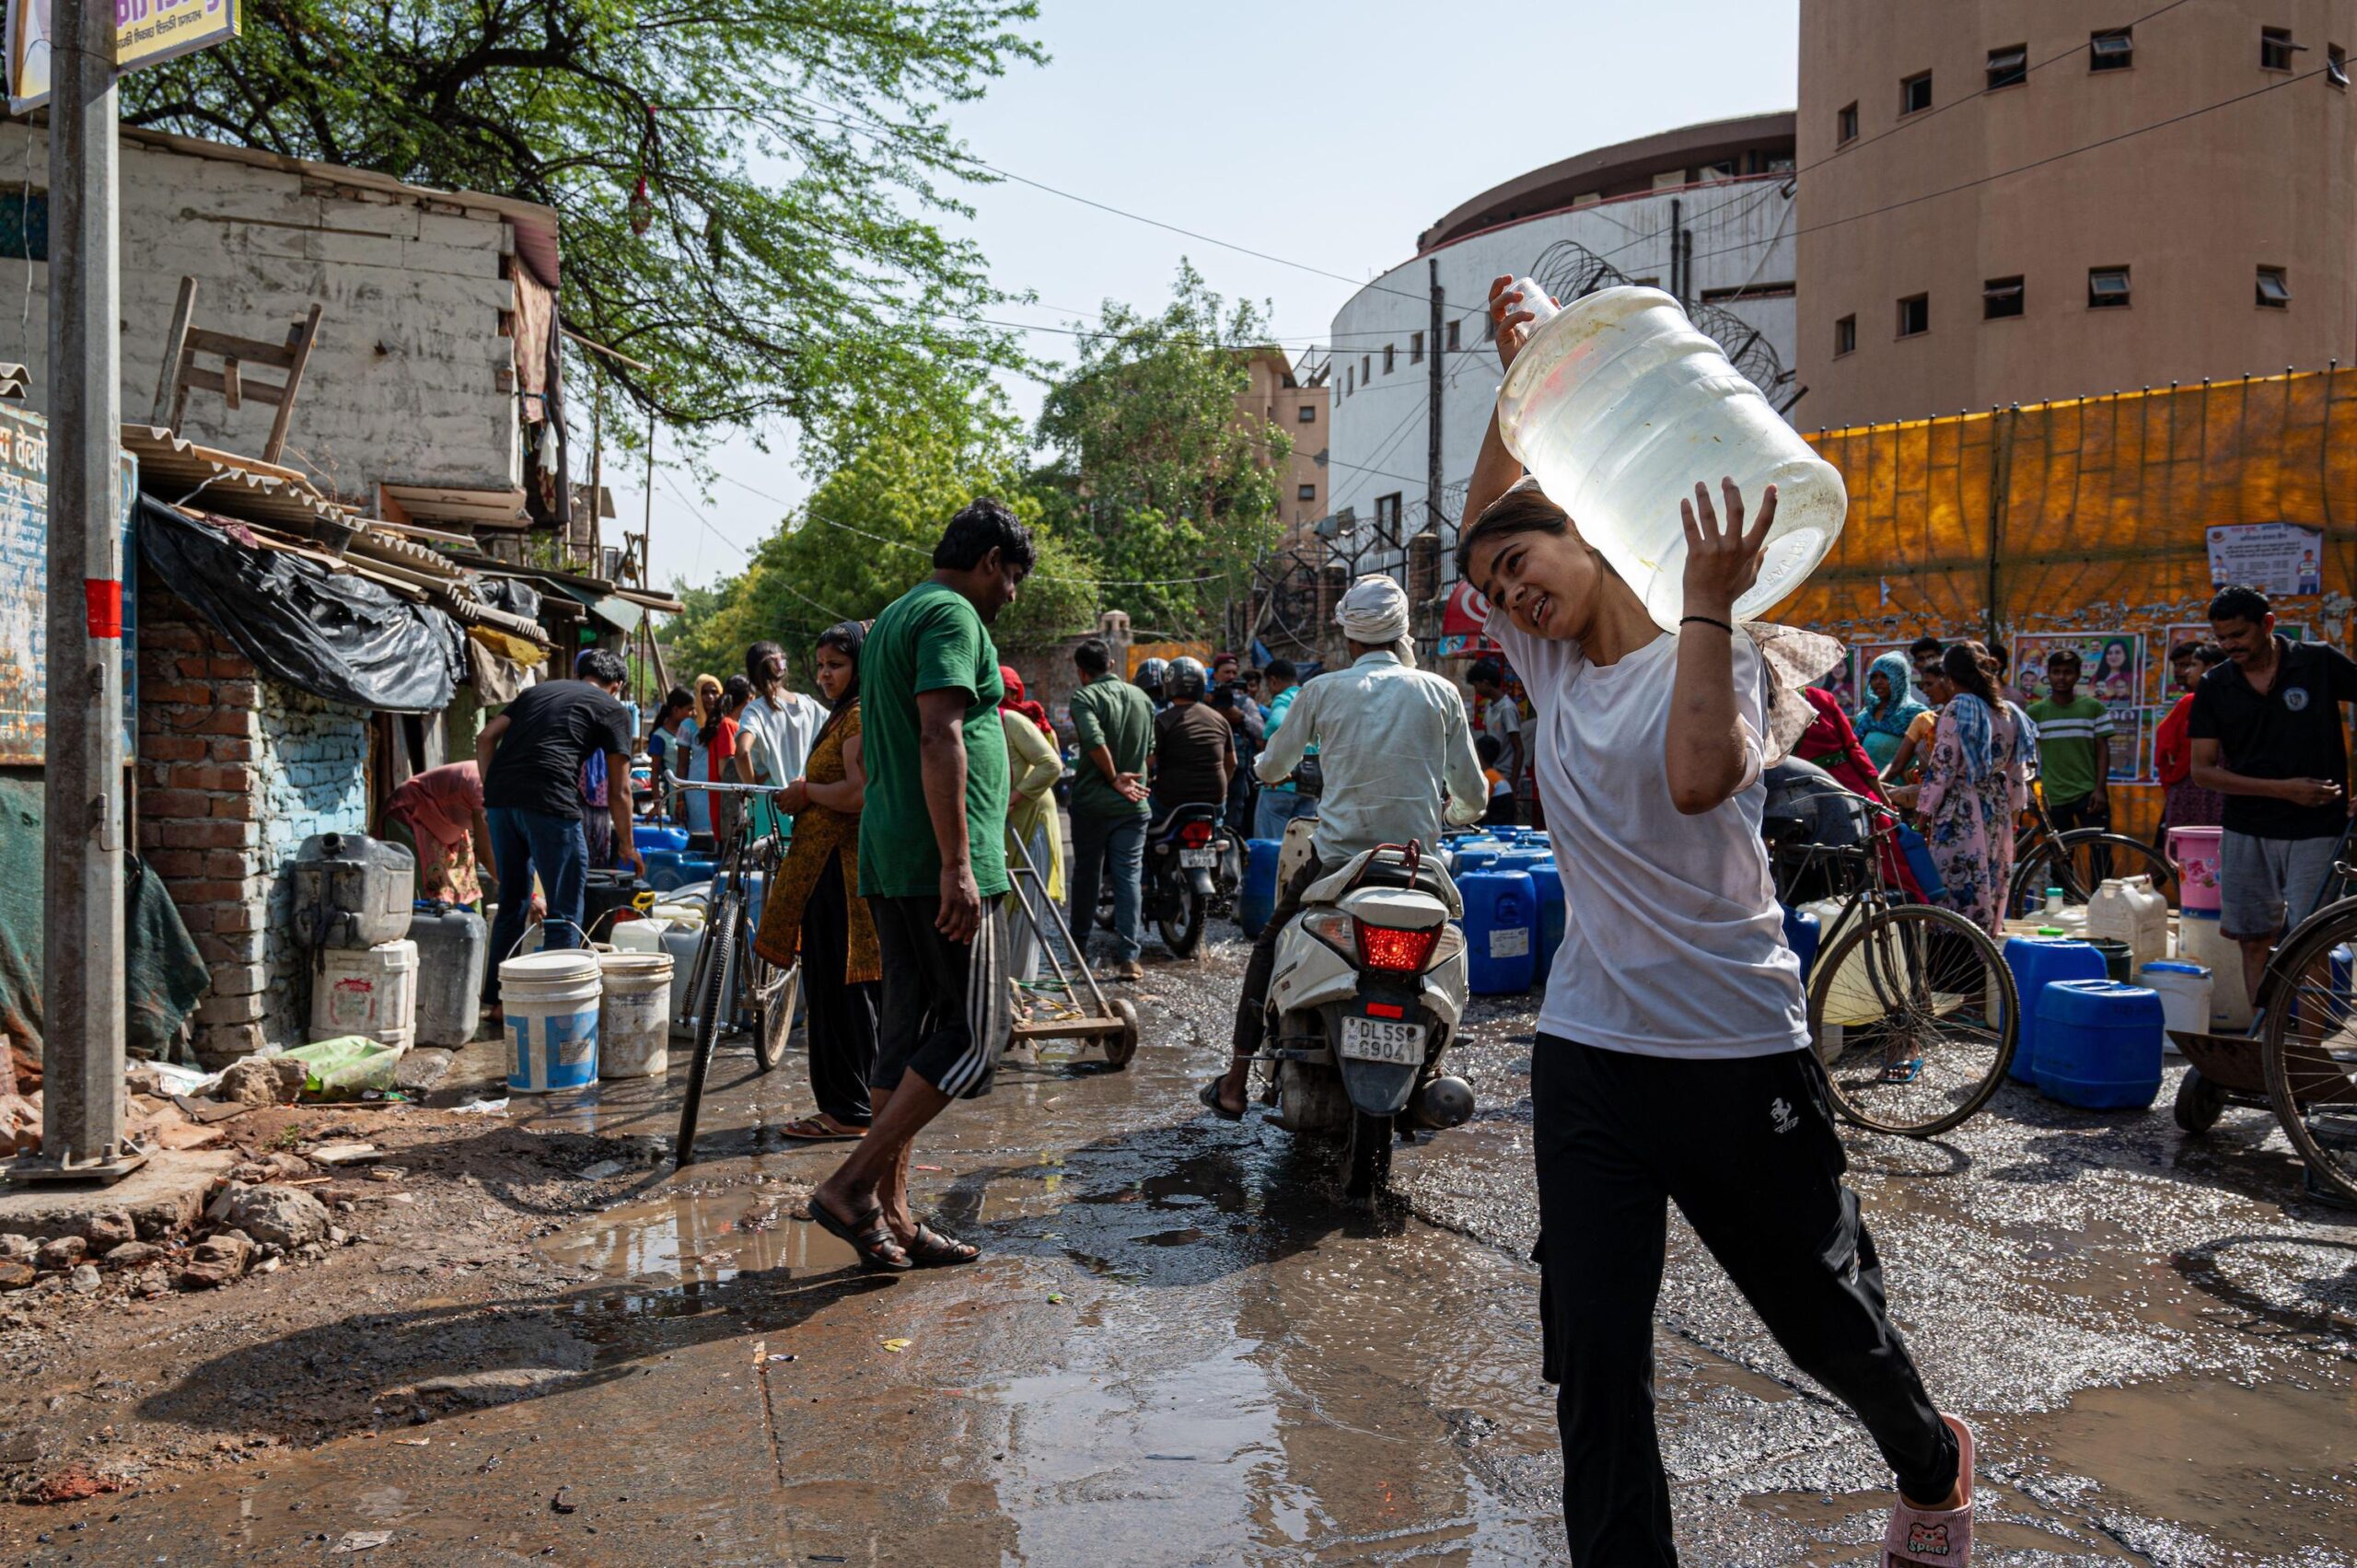
In Bengaluru, India, where the longest heat wave every year could average 13.5 days at 1.5 degrees C of warming and 37.8 days at 3 degrees C, extreme heat is already bringing severe water shortages and surging energy demand. The city is India’s fifth most populous, and 16% of its rapidly growing population live in informal settlements.
Last year, Bengaluru launched its first climate action plan, which can serve as a model for how large cities with high inequality can build resilience. The plan is inclusive by design, actively recruiting all sectors of society to participate in planning and implementing nature-based climate change solutions, like planting trees and expanding green space.
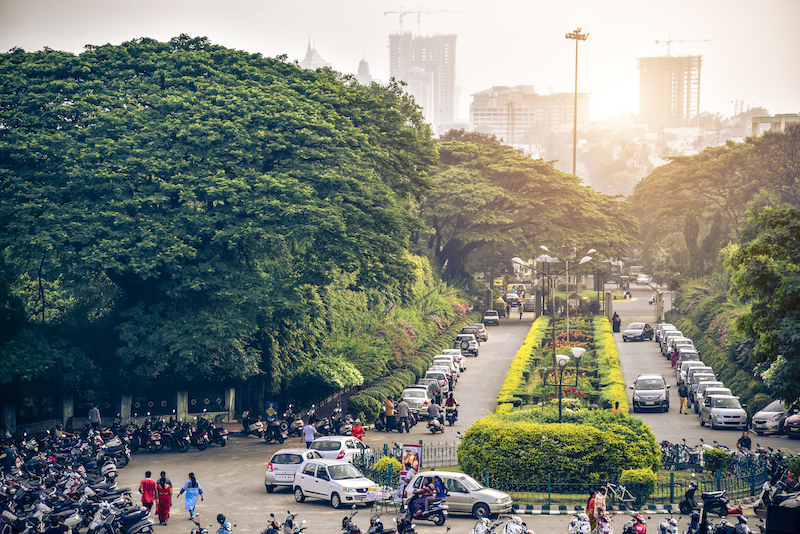
Bengaluru considers clean air and other components of human well-being in its climate plan. The plan is also broad in reach, targeting sectors like solid waste management, stormwater, greening, energy, transportation and biodiversity.
Rising Demand for Cooling
Longer, more frequent heat waves and extremely hot days will significantly raise the demand for cooling4 in homes and workplaces — and with it, demand for energy if those needs are met through mechanical means like air conditioning. Many cooling needs can be effectively met through passive cooling — including material selection, shade, insulation and ventilation — but these solutions are too often ignored in favor of mechanical methods perceived as more convenient.
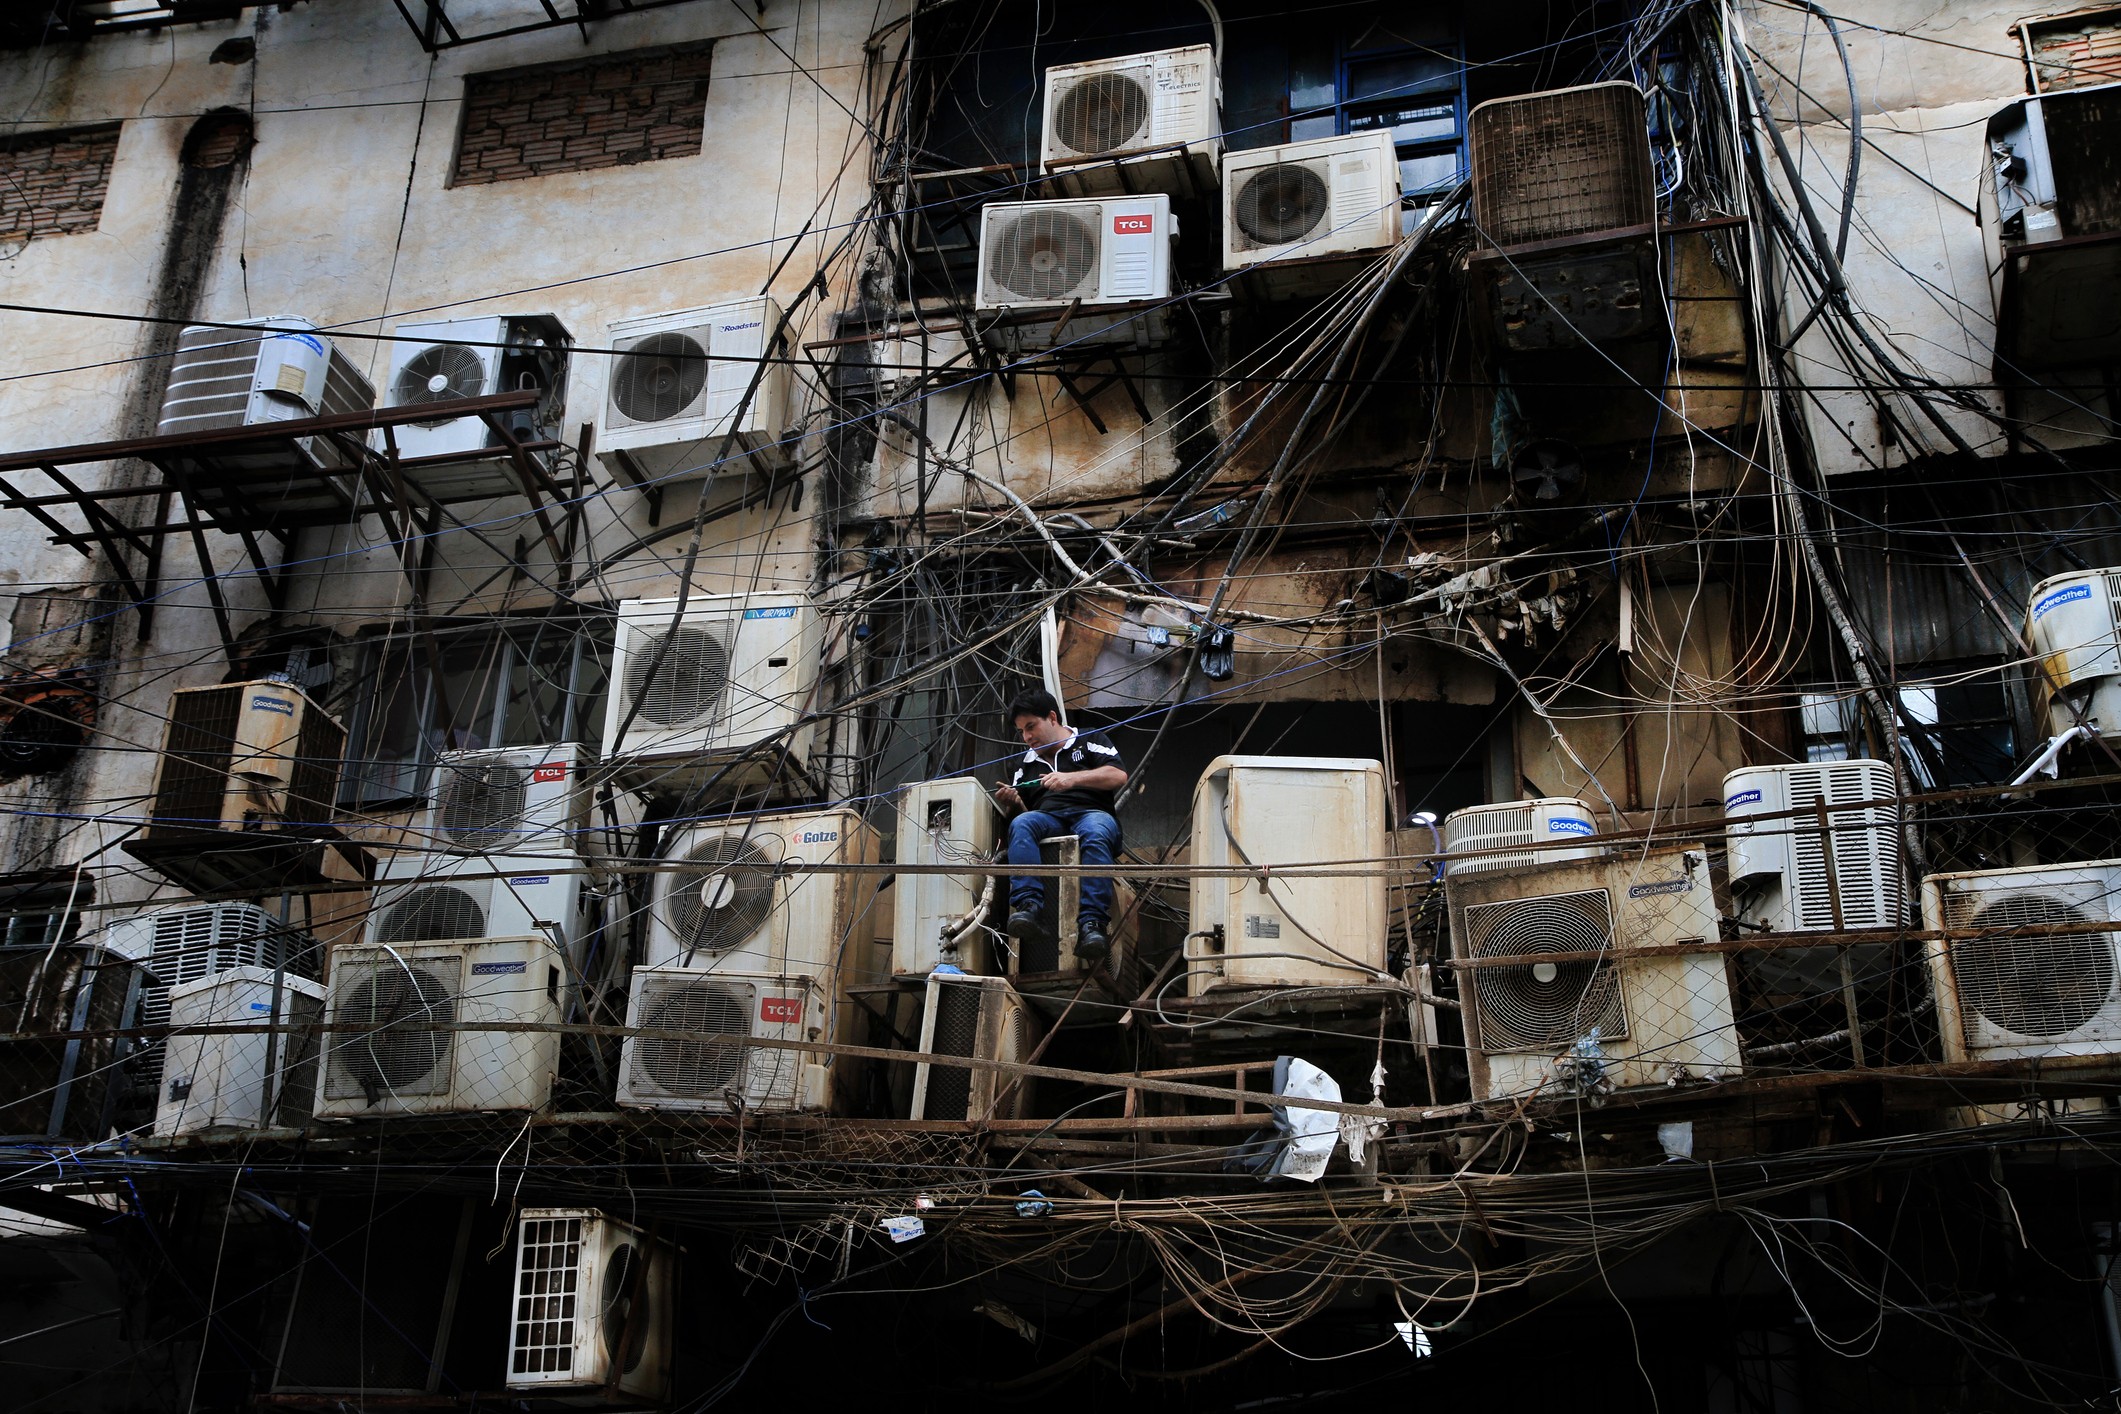
At the same time, without policies and concerted public investment in passive cooling, many poorer people in soon-to-be hotter cities won’t have access to cooling solutions. This could increase social inequity and health risks.
Only about 8% of the 2.8 billion people living in the hottest and often poorest parts of the world currently have air conditioning in their homes. For example, in India, over 215 million people in cities are already estimated to be at higher risk of heat-related health problems due to lack of cooling services and infrastructure, including more than 121 million women and girls, who are affected disproportionately by extreme heat both in health and in economic outcomes. There is a massive gap between existing cooling investment and what will be needed by 2050 to save lives, especially in lower-income countries.
City Solution: Mapping Hotspots in Johannesburg, South Africa
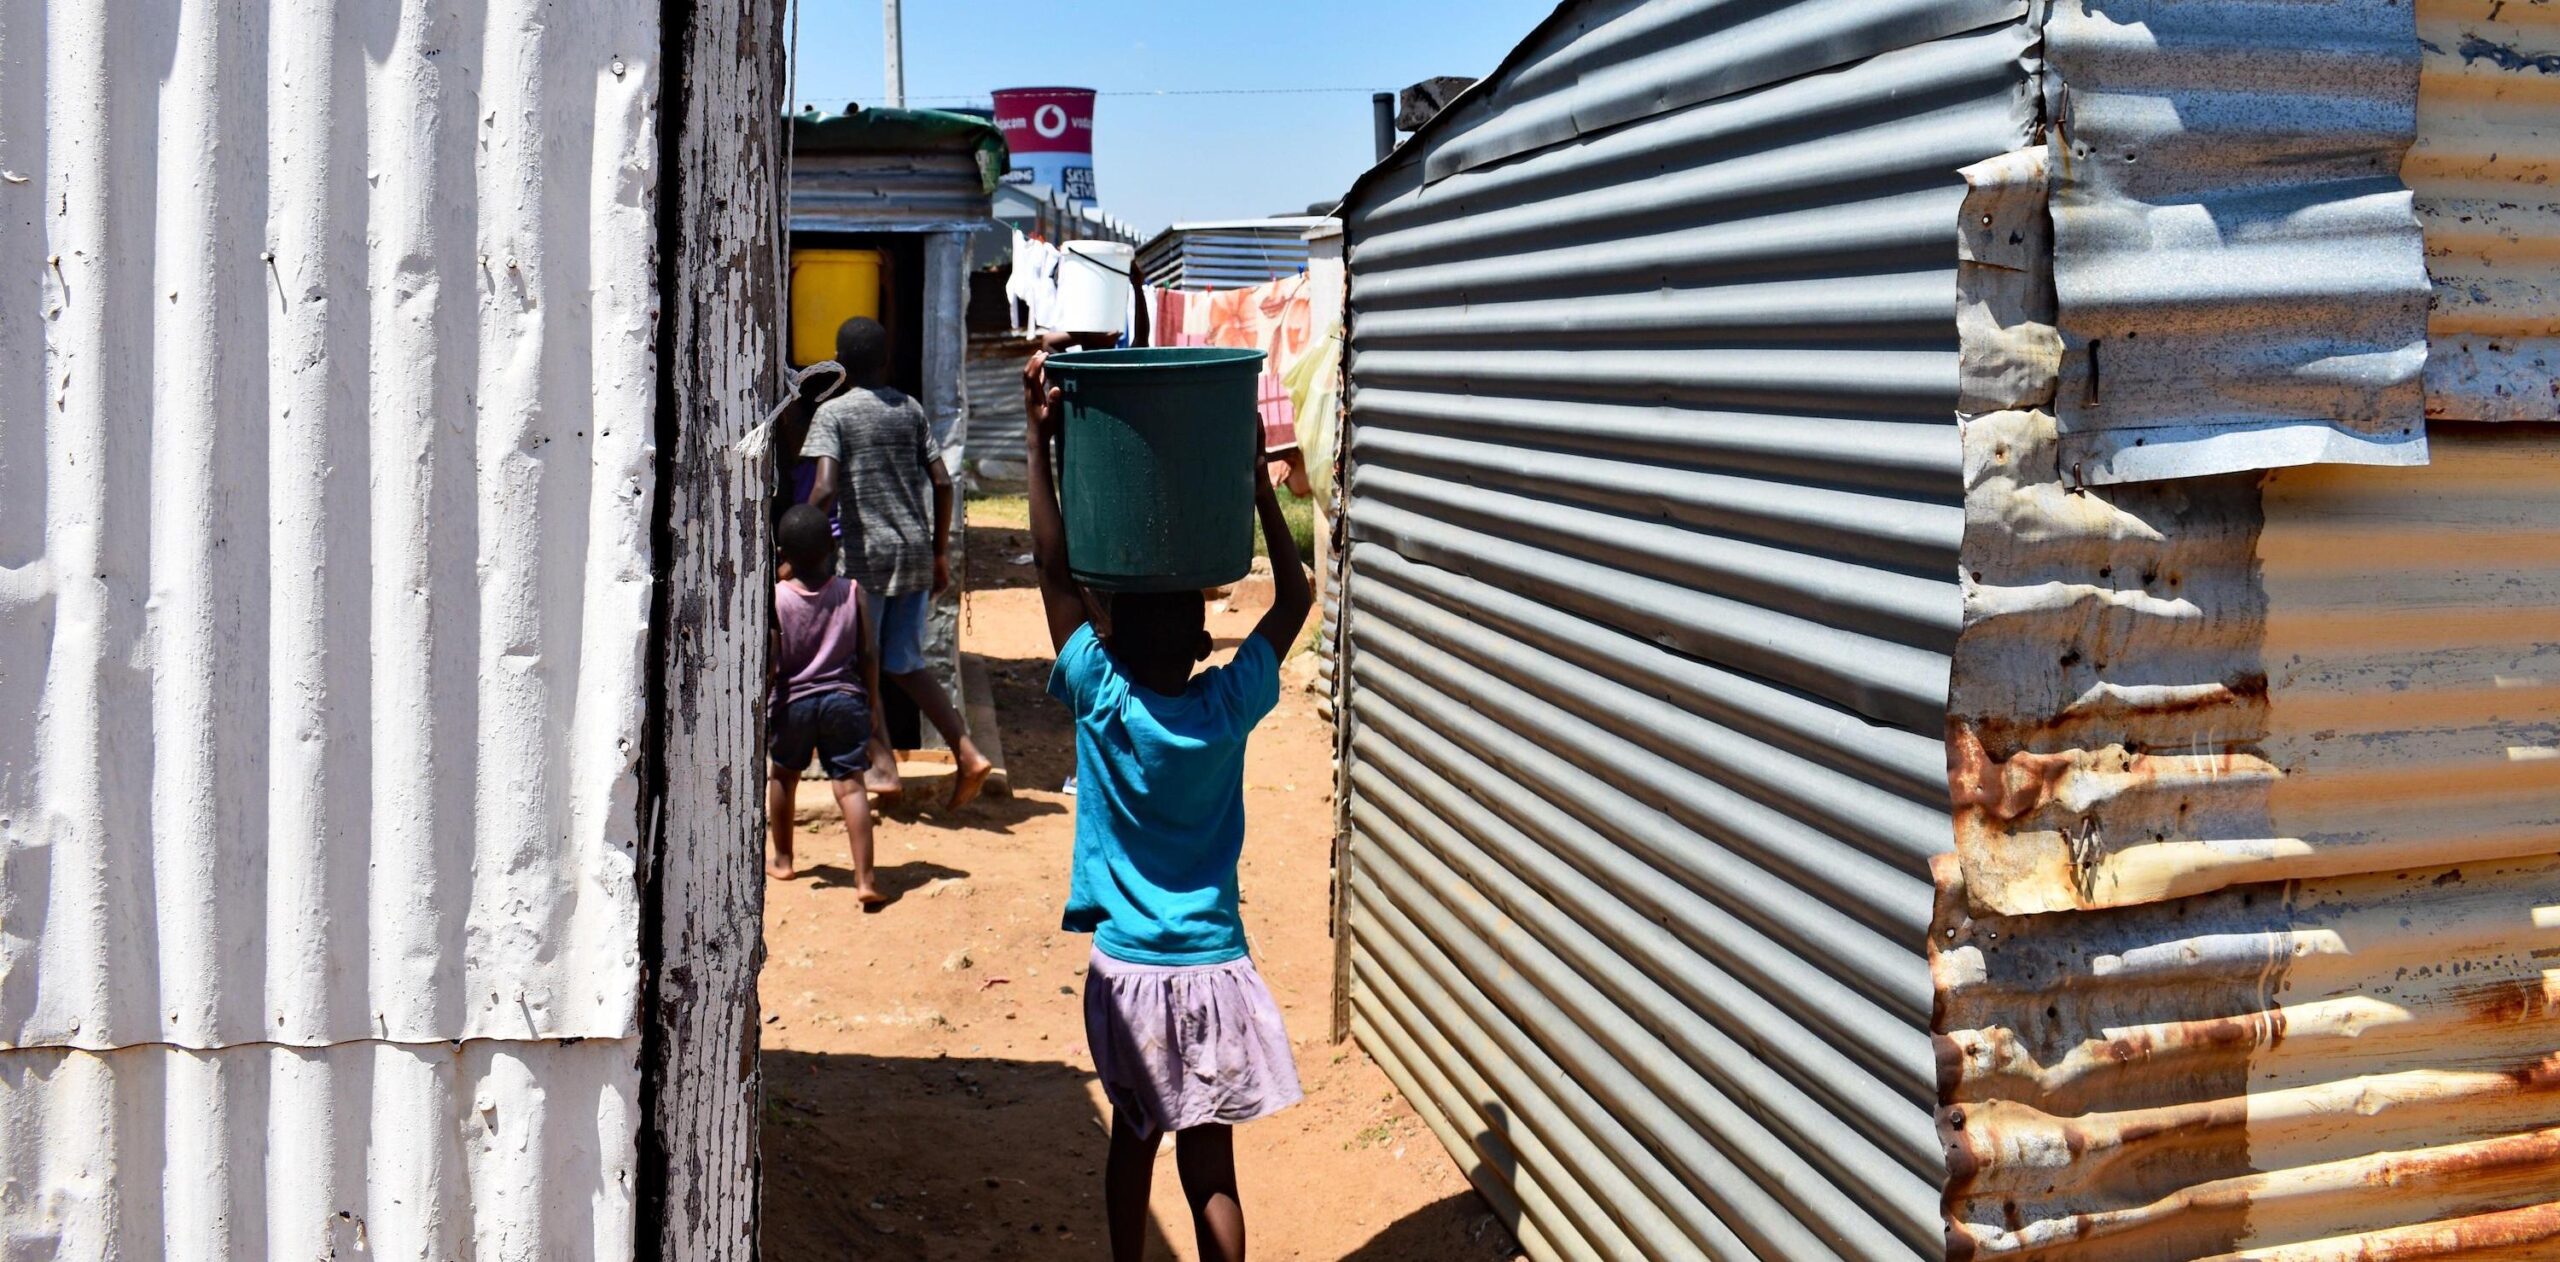
Heat waves in Johannesburg, South Africa, are becoming longer and more frequent. Johannesburg’s demand for cooling at 3 degrees C of warming is estimated to be 69% greater than at 1.5 degrees C. Air conditioning doesn’t work well when high temperatures cause water shortages and power outages, as they did in a recent heat wave that affected most of South Africa. And for many of Johannesburg’s residents who live in informal settlements — approximately 1 in 5 people — water and electricity are unreliable year-round.
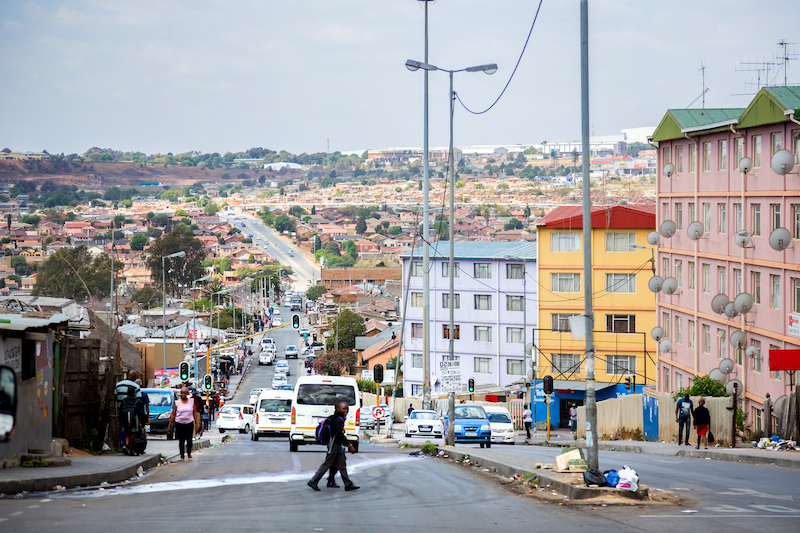
The often-deadly combination of high temperatures and high inequality in cities calls for aggressive action from governments and communities. In Johannesburg, this starts with mapping. In 2022, local government officials partnered with community volunteers to measure temperatures and create maps that show the intersection of heat and vulnerability. The effort provided decision-makers with high-quality data, built a compelling evidence base for specific cooling measures, and brought stakeholders throughout the city to the planning table. As the city proceeds with tree plantings, white roofs and other cooling initiatives, its efforts are backed by data collected by residents, improving coverage of the most vulnerable.
Growing and Shifting Disease Risks

Warmer conditions often fuel mosquito-borne diseases. Geographic patterns and prevalence of illnesses5 would shift significantly in a 3 degrees C warmer world, requiring major changes in public health priorities and investments. (Our analyses are based on changing temperatures and not on other factors affecting disease lifecycles or on current or future prevalence of disease pathogens and vectors.)
City Solution: Hunting Dengue in Rio de Janeiro, Brazil
Arboviruses are of particularly urgent concern in Latin America. Brazil is already experiencing a dengue crisis, and at 3 degrees C of warming, 11 of its largest cities could see high arbovirus risk for at least six months of the year. Rio de Janeiro may see significantly more illness if global warming reaches 3 degrees C, as the expected number of peak arbovirus days increases by 71%, from 69 to 118 days per year.
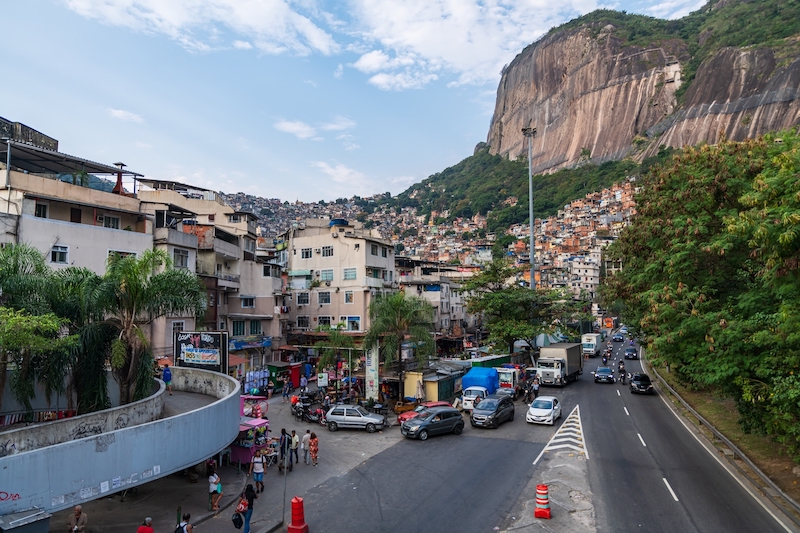
As temperatures in Rio de Janeiro become more hospitable to dengue-carrying mosquitos, the city is investing in improving the availability of dengue vaccines and controlling the mosquitos themselves. Community health workers crisscross the city, hunting for places where standing water accumulates and mosquitos can breed. And Rio de Janeiro is using another disease — Wolbachia, a bacterium that infects insects — to inhibit dengue transmission in infected mosquitos. Rio de Janeiro and five other Brazilian cities release Wolbachia-infected mosquitos by the tens of thousands. These mosquitos behave no differently from uninfected mosquitos, but they harbor less dengue virus and infect other mosquitos. A similar Wolbachia program in Yogyakarta, Indonesia, resulted in a 77% reduction of dengue incidence.
Low-income Cities Will Face Compounding Climate Risks
Climate hazards rarely come in isolation. Low-income cities, in particular, will suffer compounding risks from the interacting effects of above-average increases in temperatures and disease, potentially straining health care systems, infrastructure and budgets that are already insufficient to meet residents’ needs.
Sub-Saharan Africa is likely to be the hardest hit region for several indicators at 3 degrees C of global warming. The region’s cities may endure multiple severe climate impacts, potentially simultaneously. Comparing impacts at 1.5 degrees C versus 3 degrees C of warming, the region’s cities rank first on average for the greatest estimated increase in heat wave frequency (up 56%, to 6.5 occurrences per year) and peak arbovirus days (25 additional days, totaling 129 annually). They also see the third-largest estimated increase in the annual longest heat wave duration (up 58%, to 20 days) and the second-biggest estimated increase in energy demand for cooling (an additional 208 cooling degree days).
Although Africa is only responsible for 2%-3% of the world’s greenhouse gas emissions, many of its sub-Saharan cities are most affected by climate change-induced hazards. At 3 degrees C of warming, cities like Freetown, Sierra Leone, and Dakar, Senegal, could endure heat waves lasting longer than a month, with an average of seven heat waves in a year, demanding greater energy for cooling (13% and 20% above historical reference period averages, respectively). Many cities in the region are already dealing with rapid population growth, conflict and unregulated development. These compounding climate hazards only add to the region’s vulnerability.
Latin American cities rank second on average for the greatest estimated increase in heat wave frequency (up 48%, to 7.5 occurrences annually). The region’s cities have the second-highest estimated increase in the number of days optimal for arboviruses at 3 degrees C (13 additional days, to 91 days annually) compared to 1.5 degrees C.
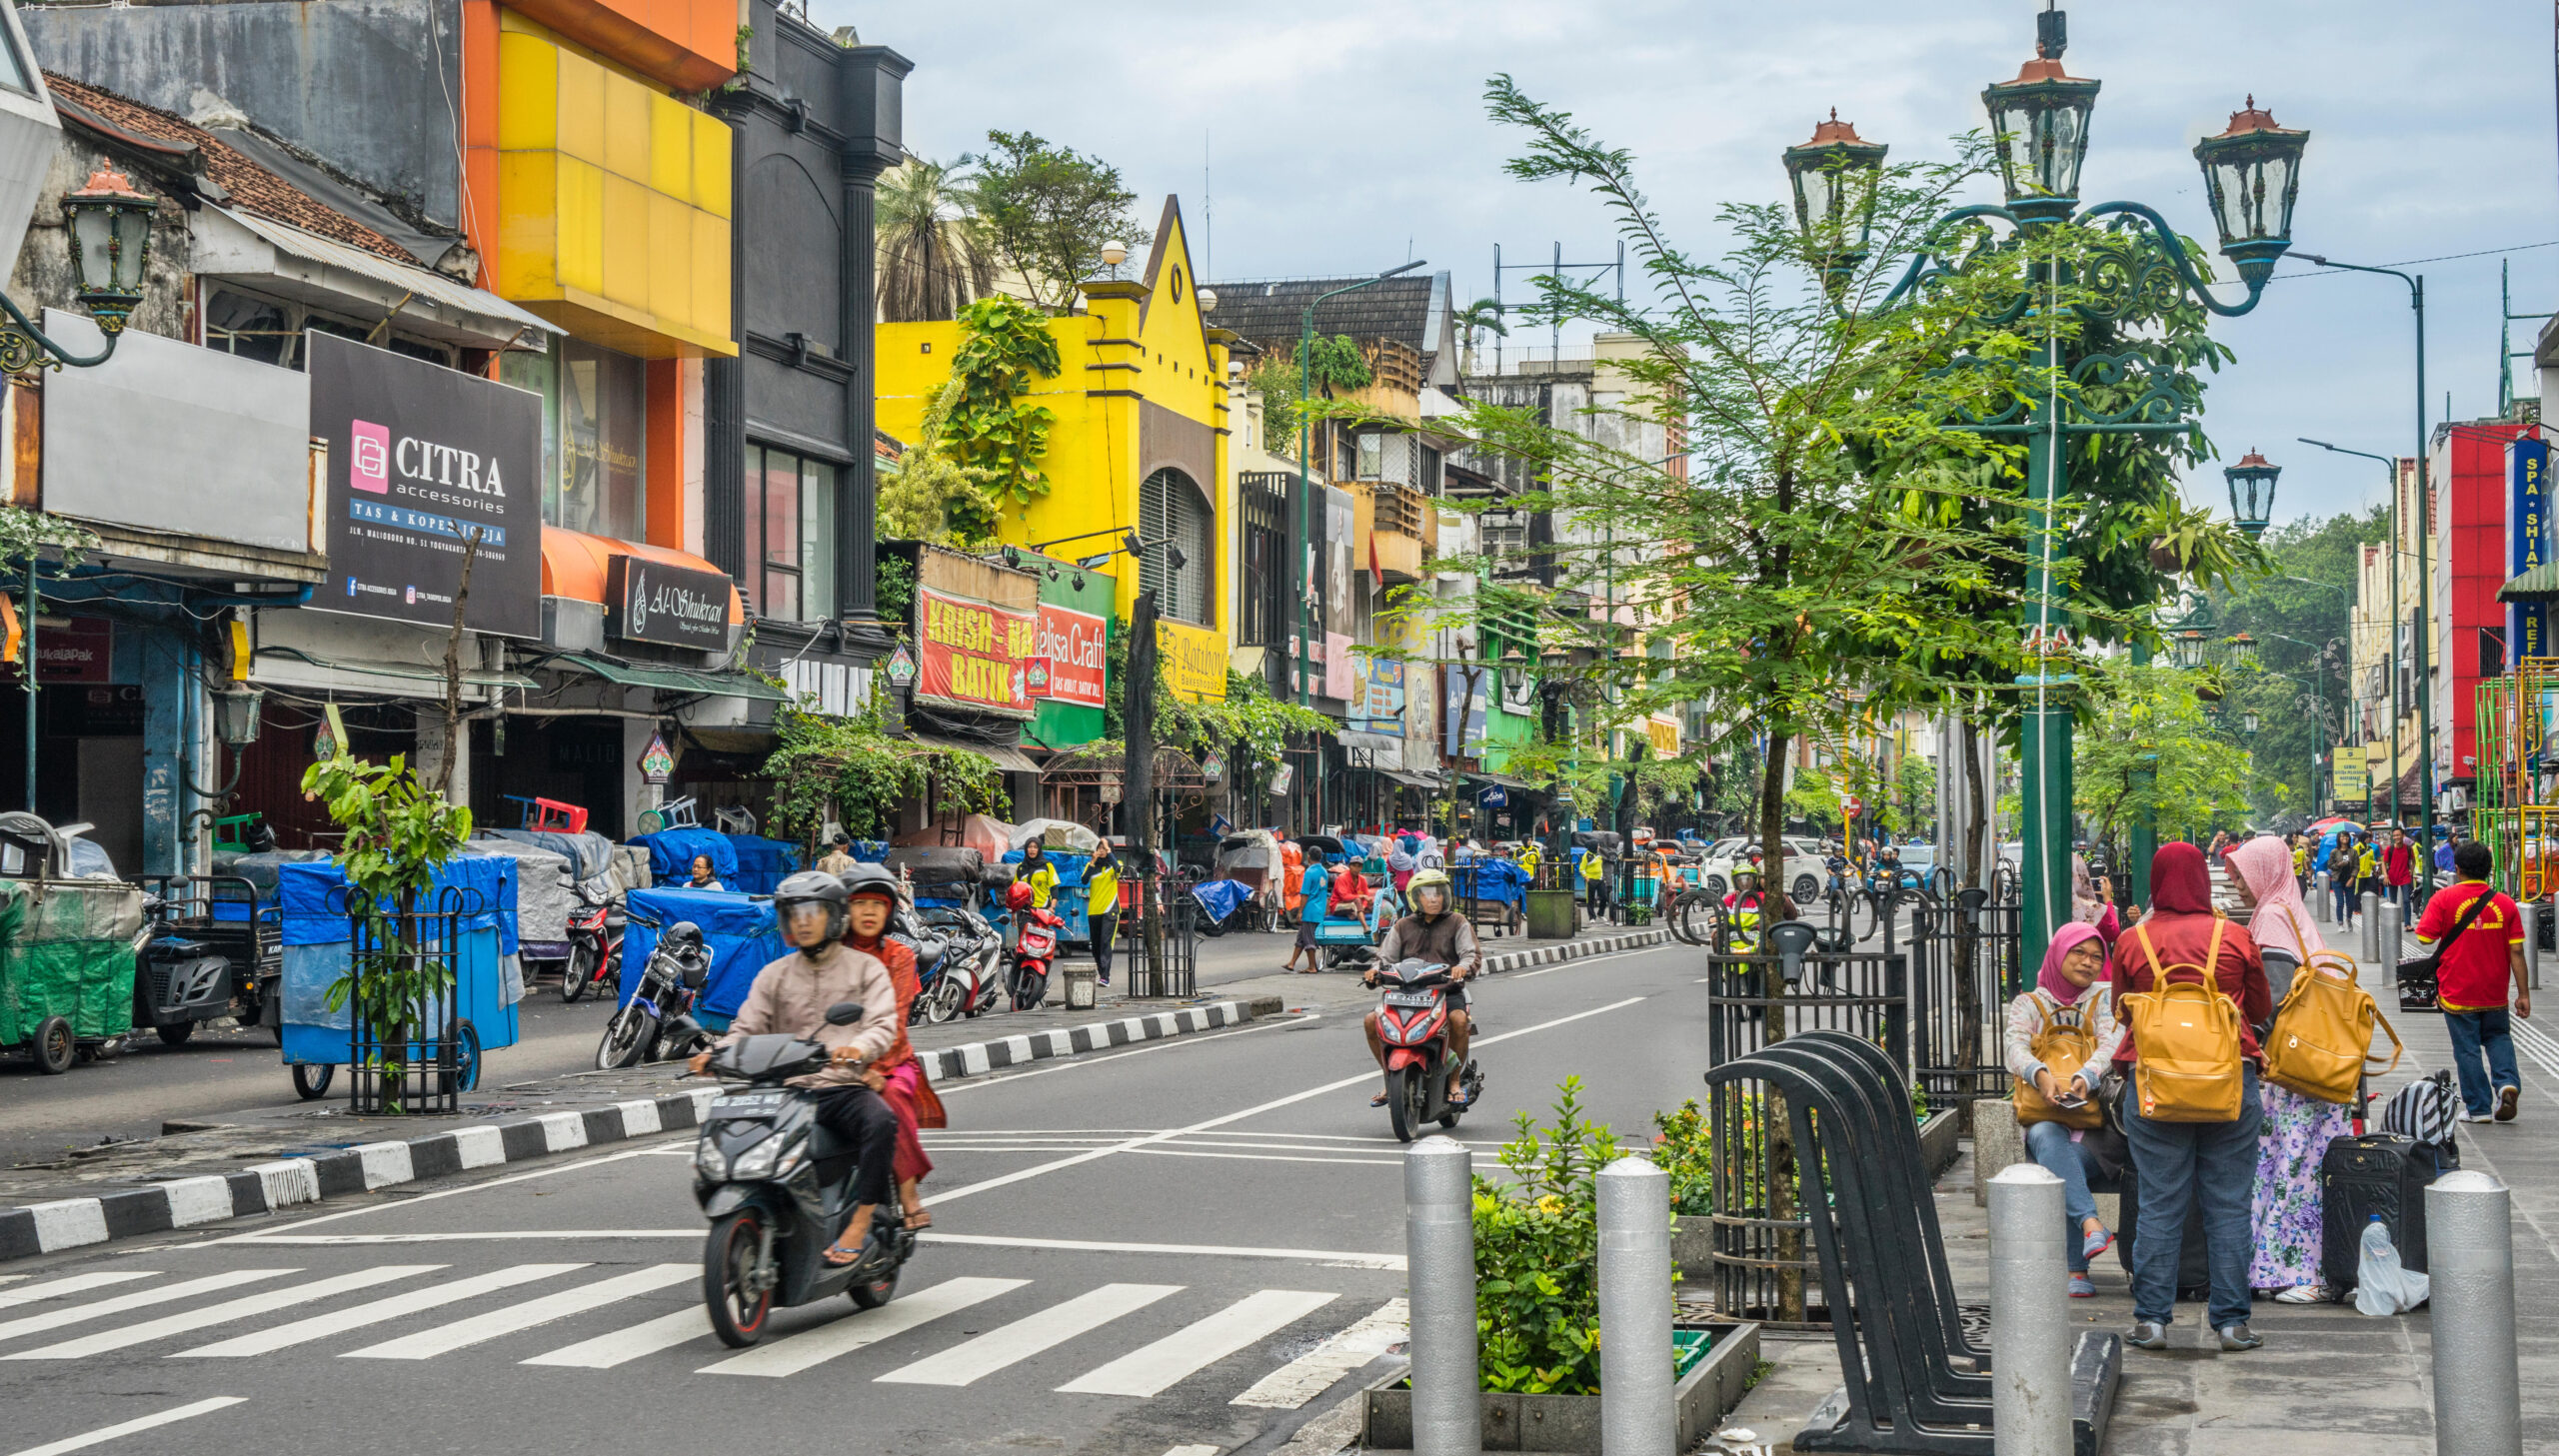
Cities in Indonesia face some of the highest compounding risks of both hotter temperatures and greater disease. Three of the four cities in the world with the greatest estimated increase in peak arbovirus days from 1.5 degrees C to 3 degrees C of warming are in Indonesia: Yogyakarta (273 day increase), Jember (151 day increase) and Padang (148 day increase).
Reaching 3 Degrees C Is Not a Foregone Conclusion
The future under 3 degrees C of warming looks dire, but these data are only an estimate of effects for one pathway. We have a choice about our climate future. The technology already exists; with the right political will, we can mitigate the worst of these effects.
National and local governments must work urgently to make their cities more climate-resilient while slashing emissions. Specific priorities include:
- Double down on policies to reduce greenhouse gas emissions: Climate problems will only worsen until the world brings greenhouse gas emissions down to net zero. National governments must implement policies aligned with the international Paris Agreement on climate change; cities can set targets and adopt policies to contribute to meeting these goals.
- Increase finance for climate adaptation: Many low-income cities have climate adaptation plans, but implementation lags due to lack of funding. Adaptation needs for low-income countries are $387 billion per year — 10-18 times bigger than current international public adaptation finance flows.
- Invest in resilient infrastructure: Adaptation solutions like cooling infrastructure, early-warning systems and heat action plans protect people’s health and boost cities’ long-term resilience. Nature-based solutions like urban forests and wetlands also do these things while bringing the added benefits of nature to city residents.
- Improve collaboration between cities and national governments, and across city departments: Multi-level partnerships and coordination are key to tackling greenhouse gas emissions and implementing resilience at the scale required to save and improve people’s lives. While in many parts of the world different levels of government tend to operate in silos, using separate strategies, some national governments see the value of cities and support them as climate-solution allies. More than 70 countries committed at the 2023 UN climate summit (COP28) to collaborate with cities on their next national climate plans, due in early 2025, through the CHAMP Initiative. Others should follow.
- Take a data-driven approach: Climate-hazard forecasts for cities can help them focus on the most likely and urgent climate risks while informing targeted investments and policies. City-scale, city-relevant data like ours should be at the center of planning and budgeting for climate adaptation and resilience.
The data for all 14 climate hazards, calculated for 996 cities, are available here. For this article, unless noted otherwise, we used the data only from the single best-performing of nine climate models for each location (the model that best matches the historical meteorological record for each city in the time periods where they overlap), but the dataset includes data from the three best-performing models. The data also include standard deviations for our estimates, as well as estimates and standard deviations of probabilities that the hazard magnitude exceed certain thresholds. The methods underlying our estimates of average hazard magnitudes and threshold-exceedance probabilities are detailed in this technical note. The methods we used to model warming scenarios and our definitions of the 14 climate hazards are detailed in this technical note.
The dataset is formatted to be of most use to data analysts equipped with statistical-analysis software. For everyone else, we’ve put together this user-friendly explorer tool.
A version of this article originally appeared on WRI’s Insights.
Ted Wong is Research and Project Associate of Data and Tools at WRI Ross Center for Sustainable Cities.
Rocío Campos is Senior Communications and Engagement Manager for WRI’s Equity Center.
Eric Mackres is Senior Manager of Data and Tools at WRI Ross Center for Sustainable Cities.
Sara Staedicke is Data Visualization Specialist for WRI.
Michael Doust is Director of Urban Efficiency & Climate for WRI Ross Center for Sustainable Cities.
Endnotes
- Our cities are based on the definitions, 2015 populations and spatial extents outlined by the GHS Urban Centre Database. ↩︎
- Exposure estimates are based on the 2020 populations in the Global Human Settlement Layer’s GHS-POP dataset. ↩︎
- There is no universally applied definition of “heat wave.” For this project, we defined it as three or more consecutive days on which the high temperature equals or exceeds the local 90th percentile of daily high temperature, as determined from the ECMWF ERA5 dataset over the 40-year period 1980–2019. ↩︎
- We looked at cooling degree days, the annual sum of positive daily average temperature deviations from a threshold temperature, and a commonly used indicator of energy demand for cooling. Specifically, we calculated CDD21, the annual sum of daily positive deviations from 21°C. ↩︎
- We used the ranges 22.9 – 27.8°C and 26 – 29°C for malaria- and arbovirus-transmitting mosquitos, respectively. These are estimated to be optimal for mosquito activity, but transmission can occur well outside these ranges. Also, note that many locations have temperatures within the optimal ranges but do not have the mosquitos. Our estimates therefore may overestimate the risk of shifting disease prevalence. ↩︎
