


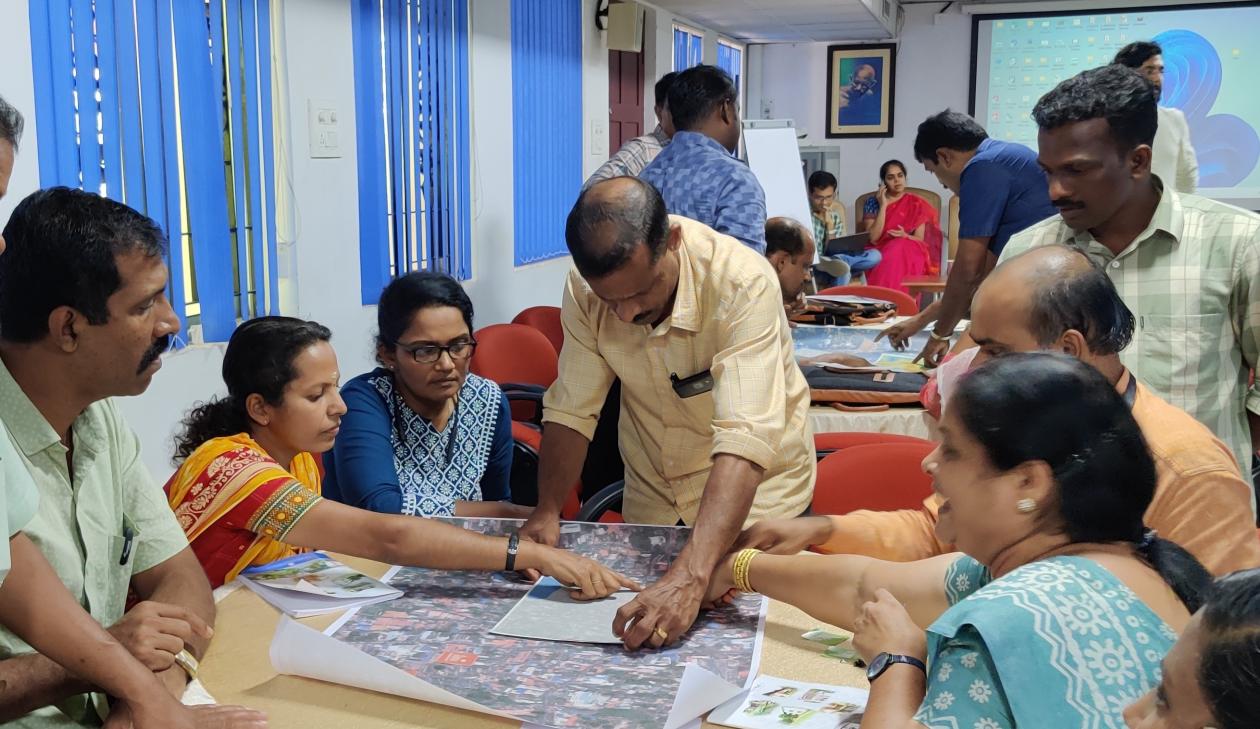
In most urban planning meetings, stakeholder engagement begins and ends with presentations. Data is shared, reports are circulated and challenges are discussed. This format often misses fostering the hands-on participation needed to tackle the local realities of climate change.
What changes when stakeholders are invited not just to view data, but to interact with it physically?
From climate hazards to mobility issues, as cities grapple with mounting challenges, data is becoming a shared language for sustainable urban planning. Yet much of this data remains locked in digital formats that require specialized software and skills, limiting access for many local actors.
Making data physical and tangible can transform decision-making:
- In Kerala, translucent hazard overlays on satellite maps helped local leaders visualize risks and identify solutions without digital tools.
- In Bengaluru, WRI India’s Namma Raste exhibition used large, printed maps and infographics to narrate the city’s transport story.
- In Bodoland, 3D-printed terrain models enabled communities to engage directly with their landscape.
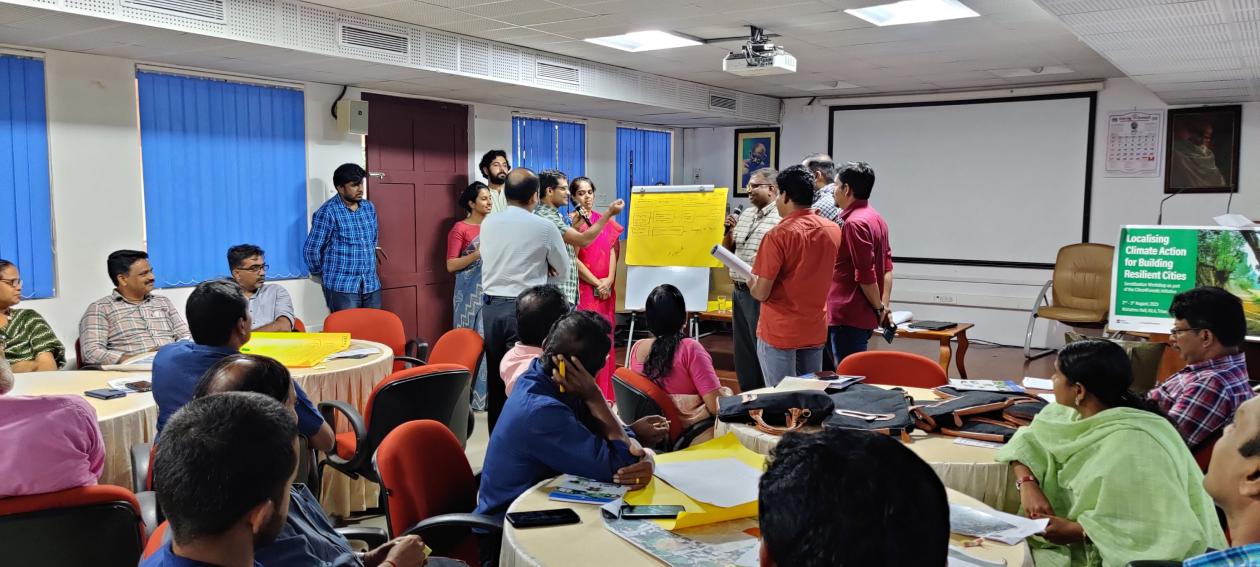
Here, we focus on Kerala, where WRI India, under the Cities4Forests initiative, conducted sensitization workshops at Kerala Institute of Local Administration in the city of Thrissur. The workshops brought together chairpersons, councilors, engineers and urban planners from 80 municipalities across Kerala.
During a key session on data-based decision-making, we invited participants to analyze a 4-square-kilometer sample area using provided datasets. This hands-on activity encouraged participants to assess the location’s geography, identify climate vulnerabilities and suggest relevant solutions — setting the stage for a more grounded and participatory approach to local planning.
Regional Customizations for Data-Based Decision-Making
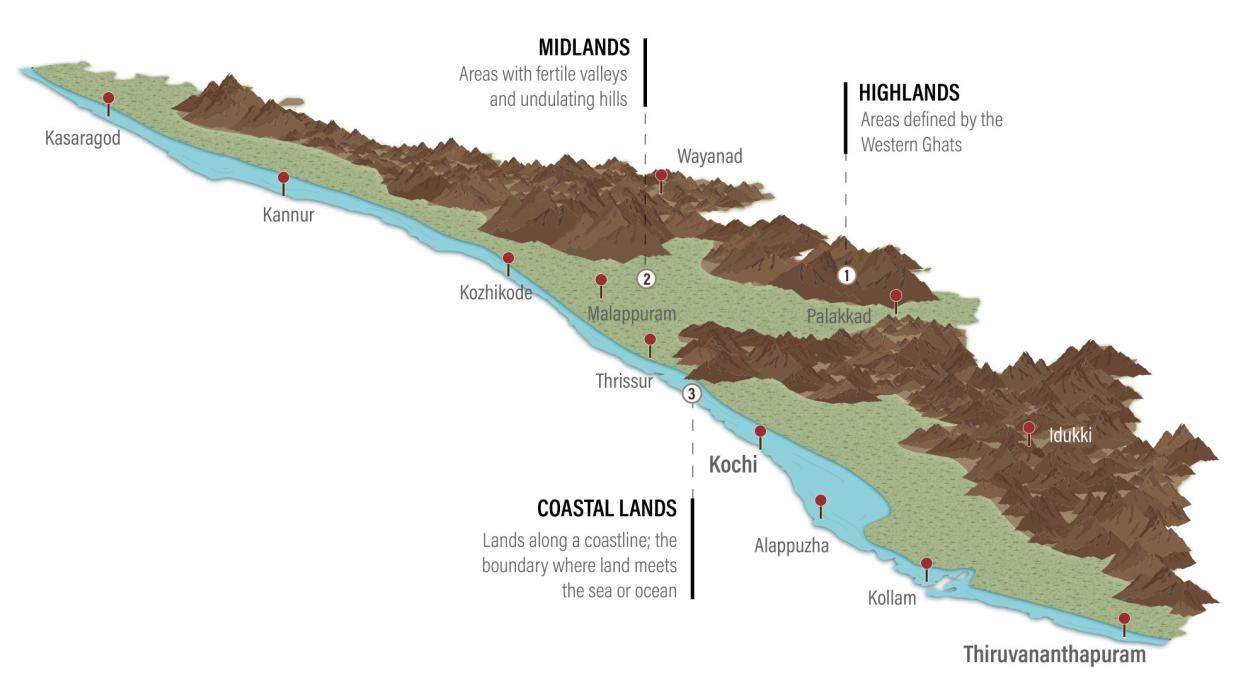
The workshop was conducted in two batches, bringing together participants from Kerala’s varied geographies—coastal, lowland, midland and highland. The first batch, comprised of representatives from coastal and lowland areas, worked primarily with satellite imagery and textual descriptions of the region’s characteristics. While discussions were active, the absence of detailed spatial context, such as elevation or terrain, meant their insights remained broad and less actionable. For example, they could identify flood-prone areas in general terms, but without precise contours or local landmarks, they could not pinpoint which neighborhood or infrastructure faced the most risks.
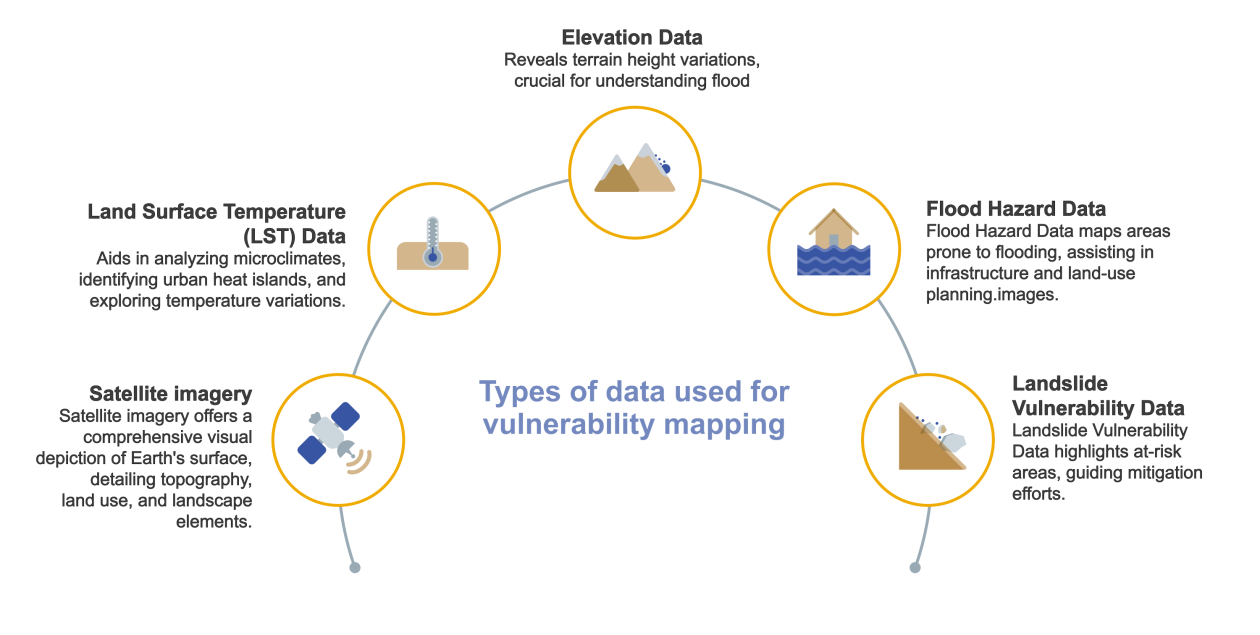
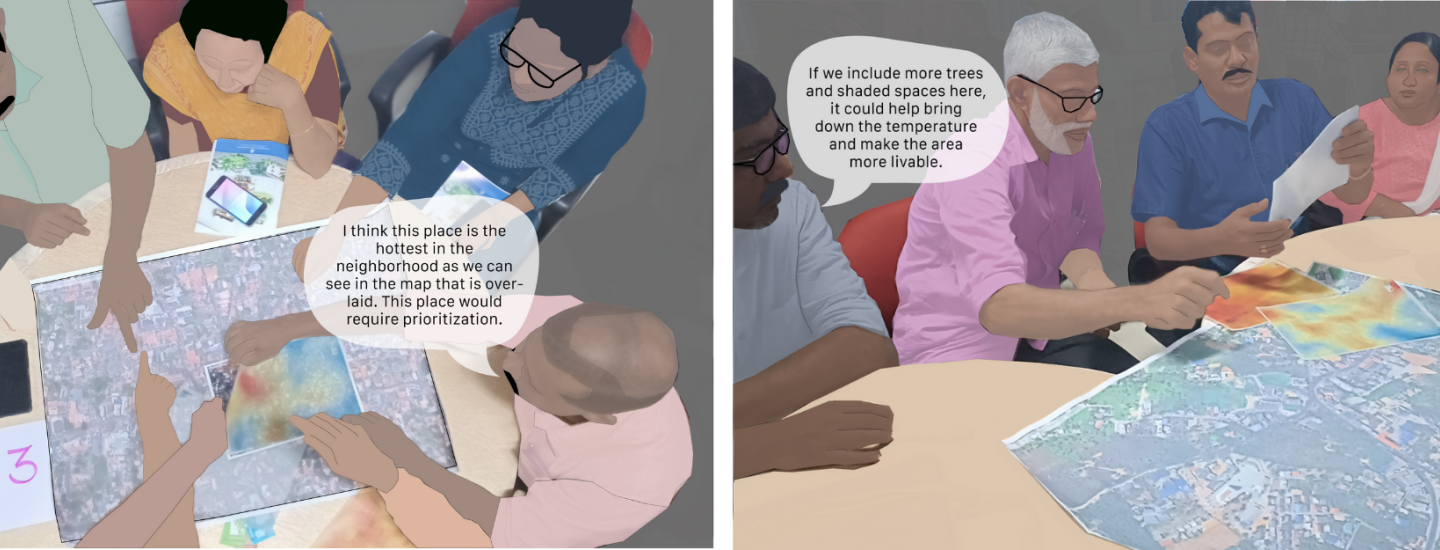
In contrast, the second batch, made up of highland and midland participants, worked with translucent thematic maps showing layers of heat, elevation, flood zones and landslide-prone areas, derived using WRI India’s Climate and Hazards Vulnerability Assessment (CHVA) methodology. By physically overlaying these maps, participants could see how risks intersect with local geography. For instance, spotting that a cluster of ”Anganwadis” (in English, “childcare centers”) and a primary health sub-center were in heat hot spots prompted ideas for adding shaded structures and cooling interventions.
Tactile maps and tools can break down technical barriers and enable more inclusive, informed and locally driven urban planning. Unlike GIS software, physical maps do not require technical skills and enable more people to get involved. The hands-on approach made it easier for everyone to understand and use the data.
Reflections From the Ground
The workshop highlighted how simple, accessible tools can transform data into a shared platform for decision-making. K.L. Kavitha, Chairperson of Chittur-Thathamangalam, noted how the tangible nature of the tools made planning more intuitive: “We could actually imagine the scenarios — data visualization brought the problems to life.” These tools are now actively shaping her municipality’s master plan, which is now witnessing greater engagement from stakeholders.
Anila Anna Verghese, Assistant Engineer at LSGD Kottayam, acknowledged the importance of data-led planning and how lack of internal capacity is a challenge: “External consultants are engaged primarily for significant project needs. The recent data session and associated activities have underscored the significance of an internal team to enhance the decision-making process.” Her reflection underlines the importance of empowering local teams to participate meaningfully in long-term decision-making.
Together, these reflections reveal a critical shift from top-down planning to a participatory process where local voices are informed, engaged and equipped to co-create resilient urban futures.
Impact and the Road Ahead
These experiences show how data and visualization tools can sharpen decision-making, while reminding us that the most powerful outcomes blend spatial insights with real-world understanding. Participants unanimously acknowledged the value of data in simplifying complex challenges and enabling wiser decisions. However, a gap remains: while many can now interpret data, few possess the tools to generate or access it independently.
The way forward lies in a twofold strategy: first, building capacity within municipalities to generate and analyze data effectively; and second, ensuring easier access to open, high-quality datasets that can support informed decision-making.
By simplifying the complexity of data generation and improving access, data can move from being a technical asset to a practical planning tool — one that enables informed, resilient and locally-led decision-making in the face of climate risks.
The workshops referenced in this article were made possible through the dedicated efforts of the organizing team, including Achu Sekhar, Shabna Seemamu and Pavan Ankanopalli.
A version of this article originally appeared on WRI-India.org.
Linda Regi is Geo-Analytics Program Associate for WRI India’s Sustainable Cities & Transport program.
Raj Bhagat Palanichamy is Senior Geo-Analytics Program Manager for WRI India’s Sustainable Cities & Transport program.
Abhimanyu S is Geo-Analytics Program Associate for WRI India’s Sustainable Cities & Transport program.
WRI India thanks Priya Narayanan for her contributions to this article.