

Posts tagged with 'data'
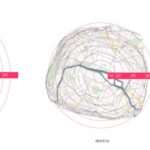
Xiaoji Chen, a graduate of the Massachusetts Institute of Technology, created isochronic maps of Paris and Singapore that represent distance on a map proportionally to travel time. The distorted maps show that the distance between any two stops in a city ...


Researchers at Carnegie Mellon University released a new smartphone application that will help transit users create a database of real-time information of their local transit agencies. Cities and transit agencies around the world are making riding easier for their customers by ...

According to a new study released by the Intelligent Transportation Society of America (ITS America), cities and states with reduced budgets are turning to technology solutions to maximize the use of existing transport infrastructure and resources. The study reports that ...

Escuelab, Softwin, Social Media Group and Development Seed are hosting an Open Data event in Lima, Peru Saturday, August 13, 2011. The event, “Open Data Meetup Lima,” is a day of sharing ideas, activities and workshops related to open data ...
Today, the U.S. Department of Energy released an interactive map displaying thousands of alternative fuel stations around the nation, as part of a complete overhaul of Energy.gov. Color-coded points represent various alternative fuel sources, including electric and hydrogen stations. In ...

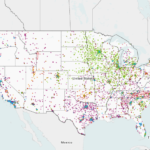
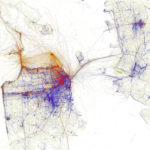
Eric Fischer, a programmer and designer, created maps showing the locations of people when they send a Twitter message or upload a photo to Flickr. Orange dots represent the location of Flickr pictures, blue dots represent Twitter tweets and white dots ...

Welcome to “Research Recap,” our series highlighting recent reports, studies and other findings in sustainable transportation policy and practice, in case you missed it. Urban Rail Reduces Air Pollution Professors Alexander Whalley and Yihsu Chen at the University of California, ...

Two research professors from the University of Michigan’s Transportation Research Institute developed an Eco-Drive Index (EDI) that estimates the average monthly environmental impact of a single driver in the United States. The value applies to newly purchased vehicles, indicating how far ...

The National Building Museum held its Intelligent Cities Forum yesterday, an all-day event that brought together experts from across the United States to explore the evolving, deep-rooted connections between technology and cities. The event covered topics ranging from education and ...
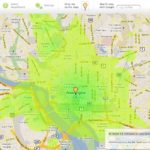
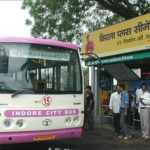
Want to know how far you can travel using public transit under 15 minutes? There’s a map for that! Stefan Wehrmeyer, a Berlin-based software architect developed a tool that uses public transit data to help users decide on where to ...
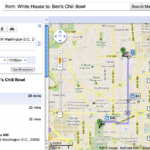
In a new partnership with the Washington Metropolitan Area Transit Authority (WMATA), Google announced a recent update to Google Maps that will now include all of D.C.’s Metro and bus stations, stops and routes, as well as connections to other ...
This interview is part of a bi-weekly series of Q&As with sustainable transportation advocates, planners, engineers, journalists, sociologists and other experts working to shed light on best practices and solutions from across the globe. We welcome your suggestions for future Q&As. ...

This interview is part of a bi-weekly series of Q&As with sustainable transportation advocates, planners, engineers, journalists, sociologists and other experts working to shed light on best practices and solutions from across the globe. We welcome your suggestions for future ...

The historic and ornate city of Arequipa is the economic and cultural hub of Southern Peru. But crowded streets, poor air quality and a disordered array of buses characterize mobility in this Andean city, the second largest in the country. ...
In a large city with broad institutional capacity like New York City, a lot of data is available. The city has access to a lot of useful numbers from a variety of sources, from community-based organizations that track the block-by-block details ...

