

Posts tagged with 'data'
This interview is part of a bi-weekly series of Q&As with sustainable transportation advocates, planners, engineers, journalists, sociologists and other experts working to shed light on best practices and solutions from across the globe. We welcome your suggestions for future Q&As. ...


This interview is part of a bi-weekly series of Q&As with sustainable transportation advocates, planners, engineers, journalists, sociologists and other experts working to shed light on best practices and solutions from across the globe. We welcome your suggestions for future ...

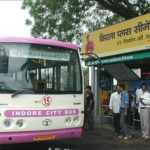
The historic and ornate city of Arequipa is the economic and cultural hub of Southern Peru. But crowded streets, poor air quality and a disordered array of buses characterize mobility in this Andean city, the second largest in the country. ...
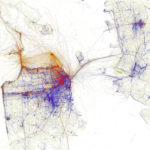
In a large city with broad institutional capacity like New York City, a lot of data is available. The city has access to a lot of useful numbers from a variety of sources, from community-based organizations that track the block-by-block details ...

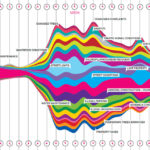
It is crucial to develop a robust, simple and meaningful set of indicators to measure the impact of transport policy on public health in order to achieve any real change in the status quo, according to Dr. Carlos Dora of ...

Researchers at the University of California are developing a study on how drivers change their behavior when they have access to instantaneous information on the efficiency of their driving. The first-of-its-kind study, led by UC Berkeley, UC Riverside and UC ...
This post is part of a series analyzing the solutions highlighted in the report and toolkit, “Megacities on the Move.” The report, written by Forum for the Future in partnership with FIA Foundation, Vodafone, and EMBARQ, offers six sustainable mobility ...
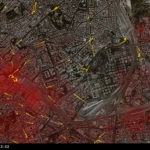
What if cities could talk? Or transit systems could tell you how they’re feeling? Sounds crazy, but it’s not that far-fetched. “Urban informatics” could change the way people understand and interact with cities, says Dan Hill, a designer, urbanist and ...

