


Posts tagged with 'data'
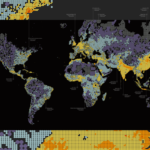
Earlier this year, we wrote about the symbolism of October 31 in marking the day the world population reached 7 billion people. A design firm based in Boston, Mass., Fathom Information Design, created “Dencity,” a map of global population density as ...

This weekend, the Desarrollando América Latina Hackathon will take place across six countries: Brazil, Mexico, Peru, Argentina, Chile and Uruguay. The event focuses on solving social problems using web applications and public data. The goal of the event is to create ...

Did you catch yesterday’s Twitter chat on what it takes to be a smarter city? To promote its 2012 Smarter Cities Challenge, IBM hosted a discussion with Stanley S. Litow, IBM’s vice president of corporate citizenship and corporate affairs and ...

The United States Department of Transportation and the Transportation Research Board are sponsoring a data visualization competition, understanding that informed decision-making, based on sound data and analysis, is the cornerstone in crafting effective transportation policies and investments. The competition is ...

Photos by the Metropolitan Transportation Authority of the State of New York Metropolitan Transportation Authority, New York City’s public transit authority, revealed a new interactive touch-screen kiosk with real-time service status on Monday. The project, “On the Go! Travel ...

The Mobility Lab, a project by the Arlington County Commuter Services, is hosting the Transit Hack Day on Saturday, September 10 for developers, mappers and transit data enthusiasts in the Washington, D.C. metro area. Transit Hack Day provides a space ...
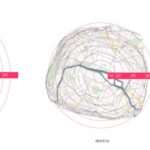
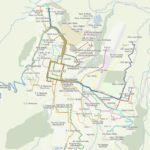
Xiaoji Chen, a graduate of the Massachusetts Institute of Technology, created isochronic maps of Paris and Singapore that represent distance on a map proportionally to travel time. The distorted maps show that the distance between any two stops in a city ...

Researchers at Carnegie Mellon University released a new smartphone application that will help transit users create a database of real-time information of their local transit agencies. Cities and transit agencies around the world are making riding easier for their customers by ...

According to a new study released by the Intelligent Transportation Society of America (ITS America), cities and states with reduced budgets are turning to technology solutions to maximize the use of existing transport infrastructure and resources. The study reports that ...

Escuelab, Softwin, Social Media Group and Development Seed are hosting an Open Data event in Lima, Peru Saturday, August 13, 2011. The event, “Open Data Meetup Lima,” is a day of sharing ideas, activities and workshops related to open data ...
Today, the U.S. Department of Energy released an interactive map displaying thousands of alternative fuel stations around the nation, as part of a complete overhaul of Energy.gov. Color-coded points represent various alternative fuel sources, including electric and hydrogen stations. In ...

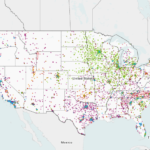
Eric Fischer, a programmer and designer, created maps showing the locations of people when they send a Twitter message or upload a photo to Flickr. Orange dots represent the location of Flickr pictures, blue dots represent Twitter tweets and white dots ...

Welcome to “Research Recap,” our series highlighting recent reports, studies and other findings in sustainable transportation policy and practice, in case you missed it. Urban Rail Reduces Air Pollution Professors Alexander Whalley and Yihsu Chen at the University of California, ...

Two research professors from the University of Michigan’s Transportation Research Institute developed an Eco-Drive Index (EDI) that estimates the average monthly environmental impact of a single driver in the United States. The value applies to newly purchased vehicles, indicating how far ...
The National Building Museum held its Intelligent Cities Forum yesterday, an all-day event that brought together experts from across the United States to explore the evolving, deep-rooted connections between technology and cities. The event covered topics ranging from education and ...
