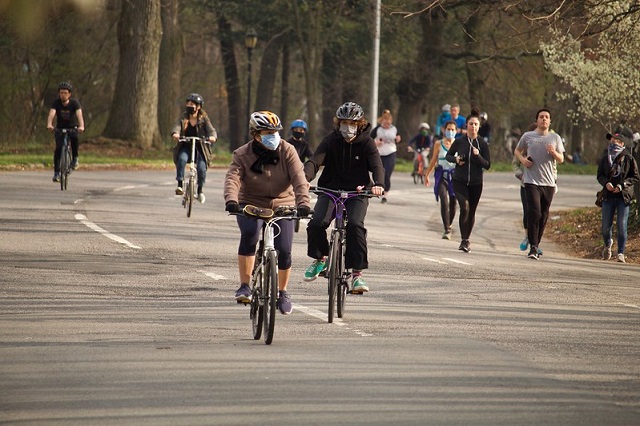
Data shows that air pollution decreased in many cities during the COVID-19 pandemic due to reduced vehicle travel. Photo by Pamela Drew/Flickr
Between the 1918 flu pandemic and the 2020 COVID-19 crisis, our ability to understand the effects of infectious diseases has increased exponentially. Networked personal devices and automated sensors are now ubiquitous, not to mention communications technologies like the internet that allow us to share information almost instantaneously. These devices provide us with copious “big data” on people’s movement, the environment, economic trends and more.
These new data – collected from an estimated 9.8 billion mobile phones, 2,200 satellites and more than 25 billion other digital sensors – are documenting the radical shifts in social and economic activities happening in response to the coronavirus pandemic. People are significantly changing their behavior, and the impacts are not affecting everyone equally.
Big data can help us not only understand the crisis and get back to normal, but create a new, better normal. Here are some early trends emerging that can inform long-term policy responses:
Parks Take on New Importance
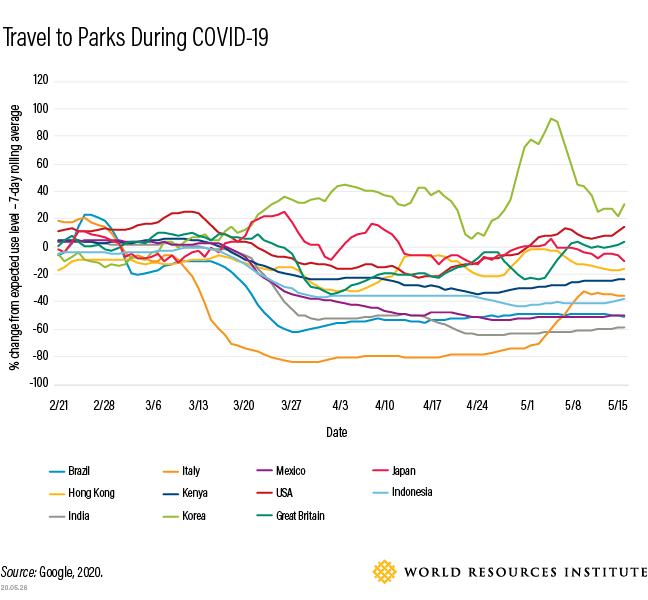
Anonymized data from mobile phones, smart devices and applications show how mobility patterns changed in response to COVID-19 lockdowns. Travel plummeted, including in private vehicles, public transit and other transport modes. In many cities, the data show that travel over that past few months has been 60-90% below normal for this time of year. Lockdowns are also affecting where people spend their time. Because of drastic declines in visits to other destinations, parks are now the most durably popular non-residential destinations, though use varies considerably by country and city.
Activity in parks remains near or just below normal for this time of year in places like Hong Kong, Japan and the United States, where safe outdoor recreation is largely encouraged and mobility restrictions are less severe than in other nations. In South Korea, activity in parks is well above average.
In other places, national and local governments have closed parks to prevent contagion. In Brazil, Italy and India, activity in parks has been actively discouraged and declined much more.

The data illustrate just how valuable green space is to many residents at this time of crisis, especially those in urban areas. And it reinforces the need for and health benefits of sufficient, accessible public parks and forested areas. For example, research found that urban trees in the United States could yield $25 million in savings just in air pollution-related health care costs and lost work days. The benefits of and need for ample green spaces should be factored into post-COVID urban planning.
But not all urban green spaces are created equal. Quality green spaces require active planning and design, as well as leaders who will step up to support making public green space a priority. They also need to be spread throughout the city to be accessible to many residents and have enough space to avoid overcrowding. South Korea is home to one of the most transformative recent urban green space projects, Seoul’s 11km-long Cheonggyecheon stream restoration. The city replaced a highway crossing the center of the city with a linear urban park that has attracted 60,000 visitors daily on average since opening. This is the sort of project other cities should consider in the aftermath of COVID-19.
Staying at Home Is Not Feasible for Everyone
Looking closer at mobility data also reveals glaring inequalities. An analysis using anonymized mobile phone data, from Cuebiq, compares the mobility of people living in neighborhoods with the highest and lowest household incomes in each urban area in the United States. Under typical conditions, people in the highest-income areas travel slightly more than those in low-income areas. Not anymore. Since social distancing began in the United States, high-income populations are traveling significantly less than people in low-income neighborhoods. High-income residential movement decreased by 90% from normal trends; in low-income areas, it only decreased 60-80%.
Evidence suggests that this is the result of more flexibility among high-income populations, who are more likely to be able to work from home and access basic needs like employment, childcare and food nearby. Many low-income workers have less secure employment, and therefore cannot afford to take time off – or are not allowed time off by their employers – and as a result, are exposing themselves to higher risk of infection by necessity, not by choice. Service employees that may be deemed essential – like grocery, shipping or delivery workers – are also more likely to live in low-income areas. These trends are most obvious in the largest metropolitan areas, many of which have significant social inequities with large populations of working poor alongside many higher-paid, more flexible workers in knowledge economy professions.
This highlights the need for better benefits and labor protections in low-paid employment, as well as the value of proximity to critical destinations and services. Accessibility of services and opportunities is a metric for urban planning that is starting to help cities understand inequality in a more tangible way. Proximity and affordability of jobs, healthcare, food, housing, broadband internet, education, green spaces and more can all be measured from neighborhood to neighborhood, giving cities more insight into vulnerability and resilience.
Reduced Economic Activity and Travel Are Reducing Air Pollution and Traffic Crashes
A decline in economic activity is having second-order effects on residents’ health. Two evident trends are decreases in outdoor air pollution from less vehicle travel and other fossil fuel combustion, and decreased injuries and deaths from traffic collisions.
Satellite readings of air quality – such as daily observations from the TROPOMI sensor on the European Space Agency’s Sentinel 5P satellite – are registering decreases in pollution compared to previous years for cities around the world. One important pollutant is nitrogen dioxide (NO2), produced from combustion of fossil fuels and linked to diseases like asthma and respiratory infections. The San Francisco Bay Area, for example, saw an estimated 20% decrease in NO2 by mid-March. The map below shows major drops in NO2 emissions in Italy from March-May 2020 compared to the same time period in 2019.
Several studies showed a correlation between long-term exposure to air pollution and increased likelihood of death from COVID-19, likely due to poor lung health. Even short-term improvements to air quality may be helping to reduce the number of deaths from other respiratory illnesses.
Similarly, traffic-related deaths and injuries were rising globally before the COVID-19 pandemic, reaching more than 1.35 million a year. Dramatic declines in motor vehicle traffic may be making a minor dent in this trendline, however. One study found that since California’s stay-at-home order went into effect on March 21, 2020, traffic injuries and deaths dropped by half. In all, the state’s lockdown has led to 15,000 fewer collisions a month compared to business as usual and 6,000 fewer injuries/fatalities, saving as much as $40 million a day in related public costs.
Both for practical and public health reasons, some places are considering major expansions of walking and cycling infrastructure after COVID-19 lockdowns. Milan, one of the first cities outside of China to be radically disrupted by the coronavirus, is planning to transform 22 miles of streets this summer with pedestrian- and bike-friendly infrastructure. The idea is to give space for street-level commerce, maintain safe distances between people, and create safer, cleaner streets. Paris and other cities have announced similar changes.
Research shows that “complete streets” and other urban planning concepts that prioritize walking and cycling can significantly reduce road traffic deaths and injuries; increase public space and opportunities for healthier, active recreation; increase economic activity; and, combined with other urban planning changes and more efficient use of cleaner energy sources, reduce air pollution.
Harnessing the Data Revolution
Advances in big data allow us a near-real time glimpse into how social disruption is impacting societies in different ways in different places. But in many cities, the promise of the data revolution remains unfilled. Too often – whether because of lack of technical capacity, entrenched interests or simply the momentum of the status quo – the extraordinary amount of data available today has little impact on the policy process.
These insights should be a wake-up call to what’s being left on the table. From public health to inequality to urban planning, advanced analytical techniques are pointing us towards a new normal that can be more resilient, safer and sustainable – if we care to listen.
How can we ensure everyone has access to sufficient green space, safe and affordable homes, employment and other critical services? Despite the challenges it presents, properly managed urban density is still the best human invention for extending access to key services. More localized data can help cities understand these problems and evaluate interventions to address them.
How can we fix the problems of social inequality that that won’t go away when this crisis is over and may well be exacerbated by it? Improving core urban services through combinations of integrating existing, informal networks and strategic infrastructure investments is important — not just to better serve vulnerable residents, but to improve the resilience of society at large.
How can we reproduce some of the health benefits from less traffic and pollution without harming economies? Better urban and regional planning is essential. Transit-oriented development and viable alternative options to driving are critical – for climate action, cleaner air and for the economic viability of dense urban cores. Road deaths are a preventable, man-made scourge, as Oslo and Helsinki have shown by becoming the first major cities in the world to record zero pedestrian deaths over a full year.
Recovery is possible, but more importantly, resilience is needed. We can’t just go back to normal, but rather, need to be better prepared for the shocks and stressors we know will come again. We have the data to point the way forward. It is our responsibility to use this new wealth of information for good.
This blog was originally published on WRI’s Insights.
Eric Mackres is the Data and Tools Manager for Urban Efficiency & Climate at WRI Ross Center for Sustainable Cities.


